
As of October 31, 2025 • 4:58 PM ETIndicators
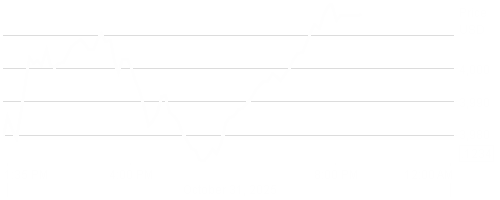
Biggest Gainers
Companies with the largest increase in price when viewed on a percentage change basis.
* Companies that meet the following criteria are included in the indicator:
- Included in the LDMicro Index or have a market cap between $10m-400m
- US / Canadian listed
- $20,000+ worth of stock traded today
| Ticker | Change |
|---|---|
| RANI | 51.72% |
| MNOV | 39.50% |
| CABA | 39.07% |
| TAO.V | 33.33% |
| MEND:CNX | 28.79% |
| IRWD | 28.00% |
| NGC.V | 25.71% |
| CLNN | 25.00% |
| KXIN | 24.86% |
| CTIB | 21.83% |
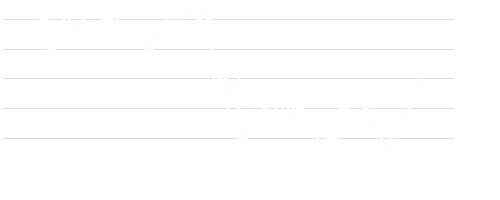
Biggest Losers
Companies with the largest decrease in price when viewed on a percentage change basis.
* Companies that meet the following criteria are included in the indicator:
- Included in the LDMicro Index or have a market cap between $10m-400m
- US / Canadian listed
- $20,000+ worth of stock traded today
| Ticker | Change |
|---|---|
| INTS | 44.68% |
| PREV.CN | 40.00% |
| FLUX | 35.25% |
| VVPR | 35.02% |
| CRBP | 26.09% |
| IPW | 25.67% |
| IDRA | 21.57% |
| NINE | 20.47% |
| TAR | 20.00% |
| OMI | 19.96% |
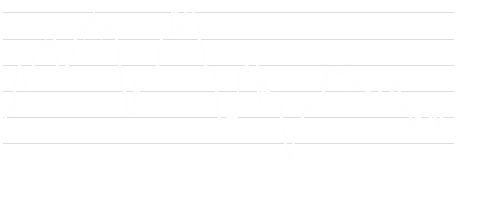
Most Active Volume
Measured as a percentage of the O/S count traded today. Percentage of O/S traded is displayed.
* Companies that meet the following criteria are included in the indicator:
- Included in the LDMicro Index or have a market cap between $10m-400m
- US / Canadian listed
| Ticker | Change |
|---|---|
| MSAI | 572.96% / OS |
| INTS | 412.62% / OS |
| FNGD | 160.09% / OS |
| SCNX | 121.02% / OS |
| DVLT | 115.73% / OS |
| BYND | 102.89% / OS |
| MNOV | 96.24% / OS |
| AQMS | 90.90% / OS |
| RANI | 69.28% / OS |
| CMBM | 65.66% / OS |
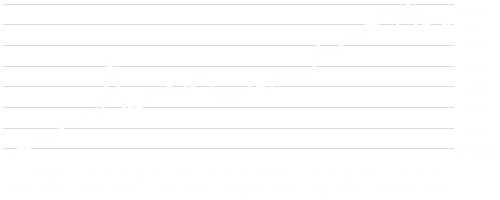
Largest Change in Volume
Number of Shares traded today vs 1 month average volume, displayed as a percentage.
* Companies that meet the following criteria are included in the indicator:
- Included in the LDMicro Index or have a market cap between $10m-400m
- US / Canadian listed
- Average value of $20,000+/day traded during last 30 days
| Ticker | Change |
|---|---|
| MNOV | 1721x avg |
| DLHC | 174x avg |
| TAIT | 65x avg |
| INOV | 61x avg |
| UTGN | 29x avg |
| CZWI | 28x avg |
| RCG.TO | 18x avg |
| MSAI | 16x avg |
| WVVI | 13x avg |
| ONTX | 12x avg |
Sector Change %
Average percentage increase/decrease of each sector in the index. No weighting.
| Sector | Change (Avg) |
|---|---|
| Healthcare | 0.74% |
| Technology | 0.62% |
| Energy | 0.57% |
| Media | 0.55% |
| Utilities | 0.41% |
| Real Estate | 0.30% |
| Finance | 0.14% |
| Basic Materials | 0.07% |
| Industrials | 0.04% |
| Consumer Discretionary | 0.25% |
| Top News | |
|---|---|
| 10/31/2025 10:54 AM EDT | El Pollo Loco Holdings Announces Third Quarter 2025 Financial Results |
| 10/31/2025 10:53 AM EDT | Koss Corporation Reports First Quarter Results |
| 10/31/2025 10:50 AM EDT | The Tile Shop to Report Third Quarter 2025 Financial Results |
| 10/31/2025 10:44 AM EDT | Sensus Healthcare Announces the Passing of Director Bill McCall |
| 10/31/2025 10:43 AM EDT | More Conferences These Days Than Investors, Insane List |
| 10/31/2025 10:39 AM EDT | Flux Power Announces Pricing of $9.6 Million Underwritten Public Offering |
| 10/31/2025 10:34 AM EDT | Sonim Technologies Reports Third Quarter 2025 Financial Results |
| 10/31/2025 10:33 AM EDT | Tego Cyber Inc. Announces Corporate Name Change to VigilAigent Corp. |
| 10/31/2025 10:30 AM EDT | New Zealand Energy Corp. Announces Management Changes |
| 10/31/2025 10:25 AM EDT | Fold and Steak 'n Shake Bring Bitcoin Rewards to the Table with New $5 Bitcoin Promotion |
Latest Press Releases
As of October 31, 2025 • 4:58 PM ETCompany Listings
| Ticker | Premium | LD Micro Index Member | Company Name | Price | Change | Volume | Market Cap | P/E | Div Yield | Exchange | Sector |
|---|