
Jun 26, 2024
Last week, Newsfile's Corine Blain and Mary Ram had the privilege of attending the Canadian Investor Relations Institute's (CIRI) 2024...
Highlights:
Winnipeg, Manitoba--(Newsfile Corp. - March 16, 2023) - Snow Lake Lithium (NASDAQ: LITM) ("Snow Lake" or the "Company") is pleased to announce the results of a metallurgical testwork program conducted for its Grass River Lithium Project.
SGS Canada were engaged to conduct the study on behalf of the Company, with a metallurgical target of producing a spodumene concentrate grading >6% Li20 and <1.0% Fe2O3 while maximising recovery. The Company is pleased to announce that these targets have been achieved with the developed flowsheet showing an 83.5% lithium recovery.
Commenting on the results of the metallurgical study, Snow Lake's Chairman, Mr Nochum Labkowski, said, "These metallurgical results from our Grass River project are tremendously encouraging with the high recovery levels demonstrating the significant commerciality of our project.
"Following the previously announced strategic review of the Company's operations we have been committed to moving our projects along the development pipeline as quickly as possible. Together with our soon to be announced mineral resource estimates, these metallurgical results will feed into our PEA which in turn will provide us with a clear pathway towards production.
"As has been previously announced, the PEA will consider launching the project with a DSO operation, thereby bringing forward cashflows whilst minimising upfront capital expenditures. DSO is a proven method of enabling a company to transition a lithium mine from initial development to producing a concentrate as has been recently demonstrated by Core Exploration.
"The next few months promises to be a very exciting time for our Company as we continue to unlock the value of our project."
Samples from the Grass River Lithium Deposit near Snow Lake, Manitoba were received at SGS Lakefield for a scoping level metallurgical testwork program on a main composite sample made from pegmatite and waste rock samples. Prior to compositing, all samples were crushed and screened to remove the -1/2 inch (-12.7 mm) and the -3/8 inch (-9.5 mm) fractions as they were not suitable for ore sorting. The coarse fraction was then sent to Steinert for ore sorting testwork. The resulting ore sorting products and the -1/2 inch and -3/8 inch fractions were combined later to produce the main composite sample for this testwork program. This program included sample preparation, head sample characterization, grindability, heavy liquid separation (HLS), dense media separation (DMS), dry magnetic separation and batch flotation testing.
The objective of the program was to evaluate the previously developed flowsheet on a larger scale and produce a larger amount of concentrate. The metallurgical target was the production of spodumene concentrate grading > 6.0% Li2O and < 1.0% Fe2O3, while maximizing lithium recovery.
The assays of the combined pegmatite and waste material as received and after crushing and classification for ore sorting are shown in Table I. Lithium and iron assays in the composite head sample were 1.24% Li2O and 2.08% Fe2O3, respectively.
Table I: Assays of the Combined Head Sample (Pegmatite and Waste) and Classified Size Fractions Prior to Ore Sorting
| Streams | Mass | Assay % | Distribution % | |||||||||||||||||
| % | Li2O | SiO2 | Al2O3 | Fe2O3 | MgO | CaO | Na2O | K2O | P2O5 | Li2O | SiO2 | Al2O3 | Fe2O3 | MgO | CaO | Na2O | K2O | P2O5 | ||
| Composite Head Sample | 100 | 1.24 | 71.2 | 16.2 | 2.08 | 0.48 | 1.16 | 4.28 | 1.74 | 0.14 | 100 | 100 | 100 | 100 | 100 | 100 | 100 | 100 | 100 | |
| Waste Head Sample | 17.6 | 0.21 | 60.2 | 16.0 | 8.49 | 1.88 | 5.01 | 2.90 | 2.51 | 0.23 | 3.0 | 14.8 | 17.3 | 71.6 | 68.0 | 75.8 | 11.9 | 25.3 | 28.4 | |
| Pegmatite Head Sample | 82.5 | 1.46 | 73.5 | 16.3 | 0.72 | 0.19 | 0.34 | 4.57 | 1.58 | 0.12 | 97.0 | 85.2 | 82.7 | 28.4 | 32.0 | 24.2 | 88.1 | 74.7 | 71.6 | |
| Coarse (+1/2") Waste Frac | 16.7 | 0.22 | 60.2 | 16.0 | 8.43 | 1.86 | 4.97 | 2.90 | 2.55 | 0.23 | 2.9 | 14.1 | 16.5 | 67.8 | 64.1 | 71.6 | 11.3 | 24.5 | 27.2 | |
| Fine (-1/2") Waste Frac | 0.8 | 0.15 | 59.0 | 15.5 | 9.64 | 2.24 | 5.81 | 2.87 | 1.70 | 0.20 | 0.1 | 0.7 | 0.8 | 3.9 | 3.9 | 4.2 | 0.6 | 0.8 | 1.2 | |
| Coarse (+1/2") Peg Frac | 68.0 | 1.62 | 73.4 | 16.7 | 0.68 | 0.17 | 0.32 | 4.54 | 1.53 | 0.13 | 88.8 | 70.1 | 70.0 | 22.2 | 23.2 | 19.0 | 72.2 | 59.8 | 60.7 | |
| Fine (-1/2") Peg Frac | 14.4 | 0.71 | 74.2 | 14.2 | 0.88 | 0.30 | 0.42 | 4.73 | 1.80 | 0.11 | 8.2 | 15.0 | 12.6 | 6.1 | 8.8 | 5.2 | 15.9 | 14.9 | 10.9 | |
Both coarse pegmatite and waste material were sent to Steinert where they would be mixed for ore sorting testwork. After ore sorting, the sorted products and rejected waste were returned to SGS for analysis; the results are presented in Table II. Ore sorting effectively rejected most of the waste material in about 20% of the mass and reduced the iron assay from 2.23% Fe2O3 to 0.68% Fe2O3 with a lithium loss of only 3.2%. As a result, the lithium grade increased from 1.43% Li2O to 1.72% Li2O in the ore sorted product.
Table II: Ore Sorting Stage Performance
| Sample ID | Weight | Assay % | Distribution % | ||||||||||||||||
| (%) | Li2O | SiO2 | Al2O3 | Fe2O3 | MgO | CaO | Na2O | K2O | P2O5 | Li | SiO2 | Al2O3 | Fe2O3 | MgO | CaO | Na2O | K2O | P2O5 | |
| Ore Sorter Product | 80.3 | 1.72 | 73.2 | 17.0 | 0.68 | 0.16 | 0.33 | 4.50 | 1.46 | 0.13 | 96.8 | 83.2 | 81.2 | 24.5 | 25.6 | 20.9 | 86.1 | 70.8 | 69.1 |
| Ore Sorter Waste | 19.7 | 0.23 | 60.1 | 16.0 | 8.53 | 1.89 | 5.08 | 2.96 | 2.45 | 0.24 | 3.2 | 16.8 | 18.8 | 75.5 | 74.4 | 79.1 | 13.9 | 29.2 | 30.9 |
| Calculated Head | 100 | 1.43 | 70.6 | 16.8 | 2.23 | 0.50 | 1.27 | 4.20 | 1.66 | 0.15 | 100 | 100 | 100 | 100 | 100 | 100 | 100 | 100 | 100 |
The main composite was prepared for beneficiation testwork by combining the ore sorted pegmatite product with the unsorted -1/2" fraction from pegmatite and waste rock material. The resulting main composite sample was assayed at 1.4% Li2O and 0.8% Fe2O3.
Two HLS tests were performed on the main composite sample at crush sizes of 100% passing -6.3 mm and -9.5 mm after first removing the -0.85 mm material via screening. HLS sinks products (SG > 2.80) were sent for dry magnetic separation to reduce the iron content in the HLS concentrate. After magnetic separation, the interpolated SG cut-points to produce a 6.0% Li2O concentrate were determined to be 2.82 and 2.85 with the -6.3/+0.85 mm and -9.5/+0.85 mm fractions, respectively (Table III). At a concentrate grade of 6.0% Li2O, the stage lithium recovery from the -6.3/+0.85 mm fraction was 86.2% at 0.94% Fe2O3, which met concentrate specifications. For the -9.5/+0.85 mm fraction, the interpolated stage lithium recovery at 6.0% Li2O and 1.18% Fe2O3 was 79.2%. Based on the high lithium recoveries in the HLS tests, the amenability of the composite (at both crushing sizes) to DMS was expected to be very good.
Thus, only the coarser crushing size of -9.5/+0.85 mm was selected for DMS operation, to reduce crushing costs. The selected SG cut points were slightly increased from the HLS interpolations to ensure the production of a 6.0% Li2O concentrate (SG 2.70 and 2.90 for 1st and 2nd passes through DMS, respectively).
Table III: Global Performance of HLS Testwork (Interpolated @ 6.0% Li2O)
| Crushed to -1/4" | Combined HLS Products | HL SG | W. | Assays (%) | Distribution (%) | ||||||||||||||
| g/cm3 | % | Li2O | SiO2 | Al2O3 | Fe2O3 | MgO | CaO | Na2O | K2O | Li | SiO2 | Al2O3 | Fe2O3 | MgO | CaO | Na2O | K2O | ||
| HLS Conc. (interpolated) | 2.82 | 17.5 | 6.00 | 65.0 | 24.6 | 0.94 | 0.15 | 0.17 | 0.91 | 0.54 | 71.8 | 15.6 | 26.3 | 18.3 | 12.7 | 7.6 | 3.6 | 5.9 | |
| HLS Middlings (interpolated) | -2.82 +2.65 | 16.6 | 0.74 | 73.5 | 15.5 | 1.05 | 0.23 | 0.52 | 4.42 | 1.90 | 8.5 | 16.7 | 15.8 | 19.5 | 18.9 | 21.9 | 16.4 | 19.6 | |
| Mag Sep Conc (3.00-2.80 SG) | 2.3 | 0.81 | 52.5 | 22.1 | 8.39 | 1.53 | 3.13 | 1.97 | 3.49 | 1.3 | 1.7 | 3.1 | 21.5 | 17.3 | 18.1 | 1.0 | 5.0 | ||
| HLS Tailings (-2.65 SG) | -2.65 | 44.2 | 0.06 | 77.0 | 13.3 | 0.38 | 0.12 | 0.24 | 6.17 | 1.80 | 1.7 | 46.6 | 36.2 | 18.7 | 26.2 | 27.0 | 60.8 | 49.6 | |
| -850 Frac | 19.5 | 1.25 | 73.6 | 15.5 | 1.01 | 0.26 | 0.52 | 4.19 | 1.64 | 16.7 | 19.6 | 18.5 | 21.9 | 24.9 | 25.4 | 18.2 | 19.9 | ||
| Feed (Calc.) | 100 | 1.46 | 73.1 | 16.3 | 0.90 | 0.20 | 0.40 | 4.48 | 1.61 | 100 | 100 | 100 | 100 | 100 | 100 | 100 | 100 | ||
| Crushed to -3/8" | Combined HLS Products | HL SG | W. | Assays (%) | Distribution (%) | ||||||||||||||
| g/cm3 | % | Li2O | SiO2 | Al2O3 | Fe2O3 | MgO | CaO | Na2O | K2O | Li | SiO2 | Al2O3 | Fe2O3 | MgO | CaO | Na2O | K2O | ||
| HLS Conc. (interpolated) | 2.85 | 17.1 | 6.00 | 65.2 | 24.5 | 1.18 | 0.17 | 0.25 | 0.81 | 0.54 | 70.9 | 15.3 | 25.8 | 23.3 | 13.8 | 8.7 | 3.0 | 5.8 | |
| HLS Middlings (interpolated) | -2.85 +2.65 | 24.3 | 0.90 | 74.9 | 14.6 | 0.87 | 0.20 | 0.78 | 4.29 | 1.57 | 15.1 | 25.0 | 21.8 | 24.4 | 24.1 | 39.7 | 22.8 | 24.0 | |
| Mag Sep Conc (3.00-2.80 SG) | 2.1 | 1.05 | 54.1 | 22.4 | 7.49 | 1.46 | 2.95 | 1.92 | 3.58 | 1.5 | 1.5 | 2.8 | 17.7 | 14.4 | 12.6 | 0.9 | 4.6 | ||
| HLS Tailings (-2.65 SG) | -2.65 | 43.2 | 0.07 | 75.6 | 14.1 | 0.32 | 0.13 | 0.25 | 6.54 | 1.90 | 2.0 | 44.8 | 37.3 | 16.0 | 26.4 | 22.2 | 61.5 | 51.5 | |
| -850 Frac | 13.3 | 1.14 | 73.0 | 15.0 | 1.20 | 0.33 | 0.60 | 4.09 | 1.69 | 10.5 | 13.4 | 12.3 | 18.4 | 21.2 | 16.7 | 11.9 | 14.1 | ||
| Feed (Calc.) | 100 | 1.45 | 72.9 | 16.3 | 0.87 | 0.21 | 0.48 | 4.59 | 1.59 | 100 | 100 | 100 | 100 | 100 | 100 | 100 | 100 | ||
The potential impact of the presence of near density material on DMS performance is presented in Table IV, based on the HLS results. A potential change in the 1st Pass DMS SG cut-point (2.70 +/- 0.02) in the first pass could result in lithium recoveries to the DMS sinks between 93% and 96% at mass recoveries between 43% and 35%. A similar fluctuation of the Pass SG-cut-point (2.90 +/- 0.02) could produce final DMS concentrate grades between 5.8% Li2O and 6.1% Li2O (+/- 0.1% Li2O) with lithium recoveries varying between 79% and 82%.
Table IV: Potential Impact of Near Density Material on DMS (Before Magnetic Separation)
| 1st pass - Stage | |||||
| SG Cut | Weight | Assay % | Distribution % | ||
| % | Li2O | Fe2O3 | Li | Fe2O3 | |
| 2.68 (-0.02) | 42.7 | 3.43 | 1.47 | 96.1 | 75.9 |
| 2.70 | 37.6 | 3.78 | 1.58 | 95.0 | 72.9 |
| 2.72 (+0.02) | 35.1 | 4.06 | 1.62 | 93.1 | 69.1 |
| 2nd pass Stage | |||||
| SG Cut | Weight | Assay % | Distribution % | ||
| % | Li2O | Fe2O3 | Li | Fe2O3 | |
| 2.88 (-0.02) | 53.3 | 5.84 | 1.70 | 82.2 | 57.4 |
| 2.90 | 51.3 | 5.94 | 1.69 | 80.5 | 54.7 |
| 2.92 (+0.02) | 49.1 | 6.05 | 1.67 | 78.5 | 51.7 |
As noted, the DMS feed was crushed to 100% passing -9.5 mm and the -0.85 mm fraction was screened out and reserved for flotation testwork. The +0.85 mm fraction was sent to DMS. The DMS test was performed in two stages. The first pass was at the lower SG cut-point of 2.70 to reject silicate gangue and the second pass was at an SG cut-point of 2.90 to generate spodumene concentrate.
Following DMS, the DMS concentrate was passed through dry magnetic separation to generate final product, while the DMS middlings and -0.85 mm fraction were combined as the flotation feed. The final non-magnetic DMS concentrate graded 6.5% Li2O and 0.98% Fe2O3 at a global lithium recovery of 67.5% (Table V). The metallurgical target grade of > 6.0% Li2O and <1.0% Fe2O3 was achieved, proving the amenability of this material (after ore sorting) to DMS. The head assay of the resulting flotation feed was ~1.45% Li2O and it contained ~25% of the total lithium distribution.
Table V: Summary of DMS Results
| Combined DMS Products | Wt. | Assay (%) | Distribution (%) | |||||||||||||||||||
| % | Li | Li2O | SiO2 | Al2O3 | Fe2O3 | MgO | CaO | Na2O | K2O | P2O5 | MnO | Li | SiO2 | Al2O3 | Fe2O3 | MgO | CaO | Na2O | K2O | P2O5 | ||
| DMS Conc. (Non Mag) | 15.0 | 3.03 | 6.52 | 64.4 | 25.2 | 0.98 | 0.14 | 0.16 | 0.69 | 0.45 | 0.10 | 0.13 | 67.5 | 13.1 | 23.3 | 18.9 | 10.0 | 6.0 | 2.2 | 4.2 | 10.8 | |
| Mag Conc. | 1.5 | 0.72 | 1.54 | 49.9 | 23.3 | 8.98 | 1.50 | 3.22 | 1.49 | 3.17 | 1.23 | 0.72 | 1.6 | 1.1 | 2.2 | 17.9 | 11.0 | 12.3 | 0.5 | 3.1 | 14.3 | |
| DMS Middlings | 11.4 | 0.83 | 1.77 | 70.8 | 17.9 | 1.48 | 0.28 | 0.64 | 3.50 | 1.76 | 0.17 | 0.10 | 14.1 | 11.0 | 12.7 | 21.7 | 15.4 | 17.9 | 8.7 | 12.6 | 14.3 | |
| DMS Tailings | 58.7 | 0.07 | 0.14 | 76.8 | 13.6 | 0.25 | 0.15 | 0.30 | 5.98 | 1.80 | 0.10 | 0.02 | 5.8 | 61.4 | 49.2 | 18.8 | 41.8 | 43.2 | 76.6 | 65.9 | 43.9 | |
| DMS U/S | 2.0 | 0.80 | 1.72 | 70.0 | 17.4 | 1.53 | 0.30 | 0.61 | 3.29 | 2.08 | 0.15 | 0.09 | 2.4 | 1.9 | 2.1 | 3.9 | 2.8 | 3.0 | 1.4 | 2.6 | 2.2 | |
| -0.85 mm frac. | 11.4 | 0.51 | 1.10 | 74.0 | 14.9 | 1.29 | 0.35 | 0.63 | 4.22 | 1.64 | 0.17 | 0.08 | 8.6 | 11.5 | 10.5 | 18.8 | 18.9 | 17.6 | 10.5 | 11.7 | 14.5 | |
| Feed (Cal.) | 100 | 0.67 | 1.44 | 73.4 | 16.2 | 0.78 | 0.21 | 0.41 | 4.58 | 1.60 | 0.13 | 0.06 | 100 | 100 | 100 | 100 | 100 | 100 | 100 | 100 | 100 | |
| Feed (Dir.) | 0.66 | 1.42 | 73.2 | 16.3 | 0.77 | 0.20 | 0.39 | 4.51 | 1.62 | 0.13 | 0.07 | |||||||||||
| Flotation Feed (Dir.) | 0.67 | 1.44 | 72.3 | 16.4 | 1.34 | 0.31 | 0.65 | 3.82 | 1.66 | 0.17 | 0.09 | |||||||||||
| Flotation Feed (Cal.) | 24.8 | 0.68 | 1.46 | 72.2 | 16.5 | 1.39 | 0.32 | 0.63 | 3.81 | 1.73 | 0.17 | 0.09 | 25.1 | 24.4 | 25.2 | 44.4 | 37.2 | 38.5 | 20.7 | 26.8 | 31.0 | |
Flotation testwork was performed to recover additional spodumene from the DMS middlings and -0.85 mm fines and produce additional concentrate. The flotation feed was stage-ground to P100 of 300 µm and two batch flotation tests were performed. The flotation flowsheet included magnetic separation, desliming, mica flotation, and spodumene flotation. Magnetic separation was also performed on the spodumene flotation concentrate, when necessary. Flotation results indicated that a collector dosage of 500 g/t FA2/TPA100 in the rougher provided the best flotation stage lithium recovery of 66% and concentrate grade in the 3rd cleaner concentrate (non-mag) of 6.22% Li2O. It is worth highlighting that the 2nd cleaner concentrate also met the >6.0% Li2O concentrate specifications at a grade of 6.05% Li2O and a lithium recovery of 71%, with an iron content very close to the cut-off limit (1.03% Fe2O3). Consequently, the final developed flowsheet needs to incorporate only two cleaning stages in the spodumene flotation circuit without the need for further magnetic separation on the flotation concentrate.
From the testwork program, the flowsheet shown in Figure I was developed. In addition, Bilmat (mass balancing software) was used to confirm the accuracy of the testwork results and aid in the overall metallurgical balance. The Bilmat results are summarized in Table VI. With the developed flowsheet, this testwork program showed that 83.5% of the lithium can be recovered at the metallurgical target grade of >6% Li2O and < 1% Fe2O3 using a combination of DMS and flotation.
Table VI: Summary of Mass Balance from Bilmat
| Streams | Mass | Assay % | Distribution % | ||||||||||||||||
| % | Li2O | SiO2 | Al2O3 | Fe2O3 | MgO | CaO | Na2O | K2O | P2O5 | Li2O | SiO2 | Al2O3 | Fe2O3 | MgO | CaO | Na2O | K2O | P2O5 | |
| Composite Head Sample | 100 | 1.24 | 71.2 | 16.2 | 2.08 | 0.48 | 1.16 | 4.28 | 1.74 | 0.14 | 100 | 100 | 100 | 100 | 100 | 100 | 100 | 100 | 100 |
| Waste Head Sample | 17.6 | 0.21 | 60.2 | 16.0 | 8.49 | 1.88 | 5.01 | 2.90 | 2.51 | 0.23 | 3.0 | 14.8 | 17.3 | 71.6 | 68.0 | 75.8 | 11.9 | 25.3 | 28.4 |
| Pegmatite Head Sample | 82.5 | 1.46 | 73.5 | 16.3 | 0.72 | 0.19 | 0.34 | 4.57 | 1.58 | 0.12 | 97.0 | 85.2 | 82.7 | 28.4 | 32.0 | 24.2 | 88.1 | 74.7 | 71.6 |
| Coarse (+1/2") Waste Frac | 16.7 | 0.22 | 60.2 | 16.0 | 8.43 | 1.86 | 4.97 | 2.90 | 2.55 | 0.23 | 2.9 | 14.1 | 16.5 | 67.8 | 64.1 | 71.6 | 11.3 | 24.5 | 27.2 |
| Fine (-1/2") Waste Frac | 0.8 | 0.15 | 59.0 | 15.5 | 9.64 | 2.24 | 5.81 | 2.87 | 1.70 | 0.20 | 0.1 | 0.7 | 0.8 | 3.9 | 3.9 | 4.2 | 0.6 | 0.8 | 1.2 |
| Coarse (+1/2") Peg Frac | 68.0 | 1.62 | 73.4 | 16.7 | 0.68 | 0.17 | 0.32 | 4.54 | 1.53 | 0.13 | 88.8 | 70.1 | 70.0 | 22.2 | 23.2 | 19.0 | 72.2 | 59.8 | 60.7 |
| Fine (-1/2") Peg Frac | 14.4 | 0.71 | 74.2 | 14.2 | 0.88 | 0.30 | 0.42 | 4.73 | 1.80 | 0.11 | 8.2 | 15.0 | 12.6 | 6.1 | 8.8 | 5.2 | 15.9 | 14.9 | 10.9 |
| Ore Sorter Product | 68.2 | 1.62 | 73.3 | 16.7 | 0.68 | 0.16 | 0.33 | 4.53 | 1.53 | 0.13 | 88.8 | 70.2 | 70.2 | 22.3 | 23.1 | 19.7 | 72.2 | 59.9 | 61.2 |
| Ore Sorter Reject | 16.6 | 0.21 | 60.2 | 16.0 | 8.49 | 1.88 | 4.96 | 2.90 | 2.56 | 0.23 | 2.9 | 14.0 | 16.4 | 67.7 | 64.3 | 71.0 | 11.3 | 24.4 | 26.7 |
| DMS Feed | 83.4 | 1.45 | 73.3 | 16.3 | 0.81 | 0.21 | 0.40 | 4.55 | 1.58 | 0.13 | 97.1 | 86.0 | 83.6 | 32.3 | 35.7 | 29.0 | 88.7 | 75.6 | 73.3 |
| DMS Feed Coarse | 72.4 | 1.49 | 73.3 | 16.4 | 0.71 | 0.19 | 0.36 | 4.62 | 1.57 | 0.12 | 86.9 | 74.6 | 73.4 | 24.9 | 27.8 | 22.7 | 78.2 | 65.3 | 62.1 |
| DMS Feed U/S | 11.0 | 1.15 | 73.3 | 15.1 | 1.40 | 0.35 | 0.66 | 4.07 | 1.62 | 0.14 | 10.2 | 11.4 | 10.3 | 7.4 | 7.9 | 6.3 | 10.5 | 10.3 | 11.2 |
| DMS 1st Pass Float | 48.6 | 0.14 | 76.8 | 13.7 | 0.25 | 0.15 | 0.29 | 5.97 | 1.79 | 0.10 | 5.6 | 52.4 | 41.0 | 5.8 | 14.6 | 12.1 | 67.8 | 50.0 | 33.9 |
| DMS 1st Pass Sink | 23.8 | 4.25 | 66.3 | 22.0 | 1.67 | 0.27 | 0.52 | 1.87 | 1.12 | 0.17 | 81.3 | 22.1 | 32.3 | 19.1 | 13.2 | 10.6 | 10.4 | 15.3 | 28.2 |
| DMS 2nd Pass Float | 9.7 | 1.68 | 70.7 | 17.6 | 1.59 | 0.29 | 0.69 | 3.54 | 1.76 | 0.15 | 13.1 | 9.6 | 10.5 | 7.4 | 5.8 | 5.8 | 8.0 | 9.8 | 10.5 |
| DMS 2nd Pass Sink | 14.1 | 6.02 | 63.3 | 25.1 | 1.72 | 0.25 | 0.40 | 0.72 | 0.68 | 0.18 | 68.3 | 12.5 | 21.8 | 11.7 | 7.4 | 4.9 | 2.4 | 5.5 | 17.7 |
| DMS Mag Conc | 1.2 | 1.54 | 49.9 | 23.3 | 9.38 | 1.50 | 3.12 | 1.48 | 3.16 | 1.15 | 1.5 | 0.8 | 1.7 | 5.4 | 3.8 | 3.3 | 0.4 | 2.2 | 9.8 |
| DMS NonMag Conc | 12.9 | 6.45 | 64.5 | 25.2 | 1.01 | 0.14 | 0.15 | 0.65 | 0.44 | 0.09 | 66.8 | 11.7 | 20.0 | 6.2 | 3.7 | 1.6 | 2.0 | 3.3 | 7.9 |
| Flot Feed | 20.7 | 1.39 | 72.1 | 16.3 | 1.49 | 0.32 | 0.67 | 3.82 | 1.69 | 0.15 | 23.2 | 21.0 | 20.8 | 14.8 | 13.7 | 12.1 | 18.5 | 20.1 | 21.7 |
| WHIMS Mag Conc | 1.2 | 1.20 | 45.7 | 21.4 | 13.0 | 2.32 | 3.13 | 1.62 | 2.26 | 0.68 | 1.2 | 0.8 | 1.6 | 7.8 | 5.9 | 3.4 | 0.5 | 1.6 | 6.0 |
| WHIMS NonMag Prod | 19.5 | 1.41 | 73.8 | 15.9 | 0.75 | 0.19 | 0.52 | 3.96 | 1.65 | 0.11 | 22.0 | 20.2 | 19.2 | 7.1 | 7.7 | 8.7 | 18.0 | 18.5 | 15.7 |
| 1st slimes | 1.8 | 0.97 | 66.1 | 18.9 | 1.69 | 0.65 | 0.98 | 3.95 | 2.80 | 0.16 | 1.4 | 1.7 | 2.1 | 1.5 | 2.4 | 1.5 | 1.7 | 2.9 | 2.1 |
| 1st Deslimed Prod | 17.7 | 1.45 | 74.5 | 15.7 | 0.66 | 0.15 | 0.47 | 3.96 | 1.53 | 0.11 | 20.6 | 18.5 | 17.1 | 5.6 | 5.3 | 7.2 | 16.4 | 15.6 | 13.7 |
| Mica Conc | 1.7 | 0.95 | 54.6 | 27.3 | 2.33 | 0.29 | 0.56 | 1.86 | 7.41 | 0.25 | 1.3 | 1.3 | 2.9 | 1.9 | 1.0 | 0.8 | 0.7 | 7.3 | 3.0 |
| Mica Tailings | 16.0 | 1.50 | 76.7 | 14.4 | 0.48 | 0.13 | 0.46 | 4.19 | 0.90 | 0.10 | 19.3 | 17.2 | 14.2 | 3.7 | 4.3 | 6.4 | 15.6 | 8.3 | 10.7 |
| 2nd slimes | 0.3 | 1.05 | 69.3 | 16.4 | 1.01 | 0.64 | 1.55 | 4.25 | 1.52 | 0.12 | 0.3 | 0.3 | 0.3 | 0.2 | 0.4 | 0.5 | 0.3 | 0.3 | 0.3 |
| 2nd Deslimed Prod | 15.6 | 1.51 | 76.8 | 14.4 | 0.47 | 0.12 | 0.44 | 4.19 | 0.89 | 0.09 | 19.0 | 16.9 | 13.9 | 3.5 | 3.9 | 5.9 | 15.3 | 8.0 | 10.4 |
| Spod Ro Conc | 4.3 | 5.31 | 64.3 | 23.5 | 0.97 | 0.29 | 1.03 | 1.34 | 0.50 | 0.28 | 18.4 | 3.9 | 6.2 | 2.0 | 2.6 | 3.8 | 1.3 | 1.2 | 8.6 |
| Spod Ro Tail | 11.3 | 0.07 | 81.6 | 10.9 | 0.28 | 0.05 | 0.21 | 5.27 | 1.04 | 0.02 | 0.7 | 13.0 | 7.6 | 1.5 | 1.3 | 2.1 | 14.0 | 6.8 | 1.8 |
| Spod Scav Conc | 0.2 | 1.94 | 70.1 | 18.0 | 1.12 | 0.28 | 0.72 | 3.63 | 1.35 | 0.04 | 0.3 | 0.2 | 0.2 | 0.1 | 0.1 | 0.1 | 0.2 | 0.2 | 0.1 |
| Spod Scav Tail | 11.1 | 0.04 | 81.8 | 10.8 | 0.26 | 0.05 | 0.20 | 5.30 | 1.04 | 0.02 | 0.4 | 12.8 | 7.4 | 1.4 | 1.2 | 1.9 | 13.8 | 6.6 | 1.8 |
| Spod Cl Conc | 3.4 | 6.17 | 62.6 | 24.9 | 1.03 | 0.29 | 1.13 | 0.69 | 0.33 | 0.35 | 16.7 | 3.0 | 5.2 | 1.7 | 2.0 | 3.3 | 0.5 | 0.6 | 8.3 |
| Spod Cl Tail | 0.9 | 2.19 | 70.6 | 18.3 | 0.78 | 0.29 | 0.70 | 3.67 | 1.10 | 0.04 | 1.6 | 0.9 | 1.1 | 0.3 | 0.6 | 0.6 | 0.8 | 0.6 | 0.3 |
| Combined Flot and DMS Conc | 16.2 | 6.39 | 64.1 | 25.2 | 1.01 | 0.17 | 0.35 | 0.66 | 0.42 | 0.14 | 83.5 | 14.6 | 25.2 | 7.9 | 5.7 | 4.9 | 2.5 | 3.9 | 16.2 |
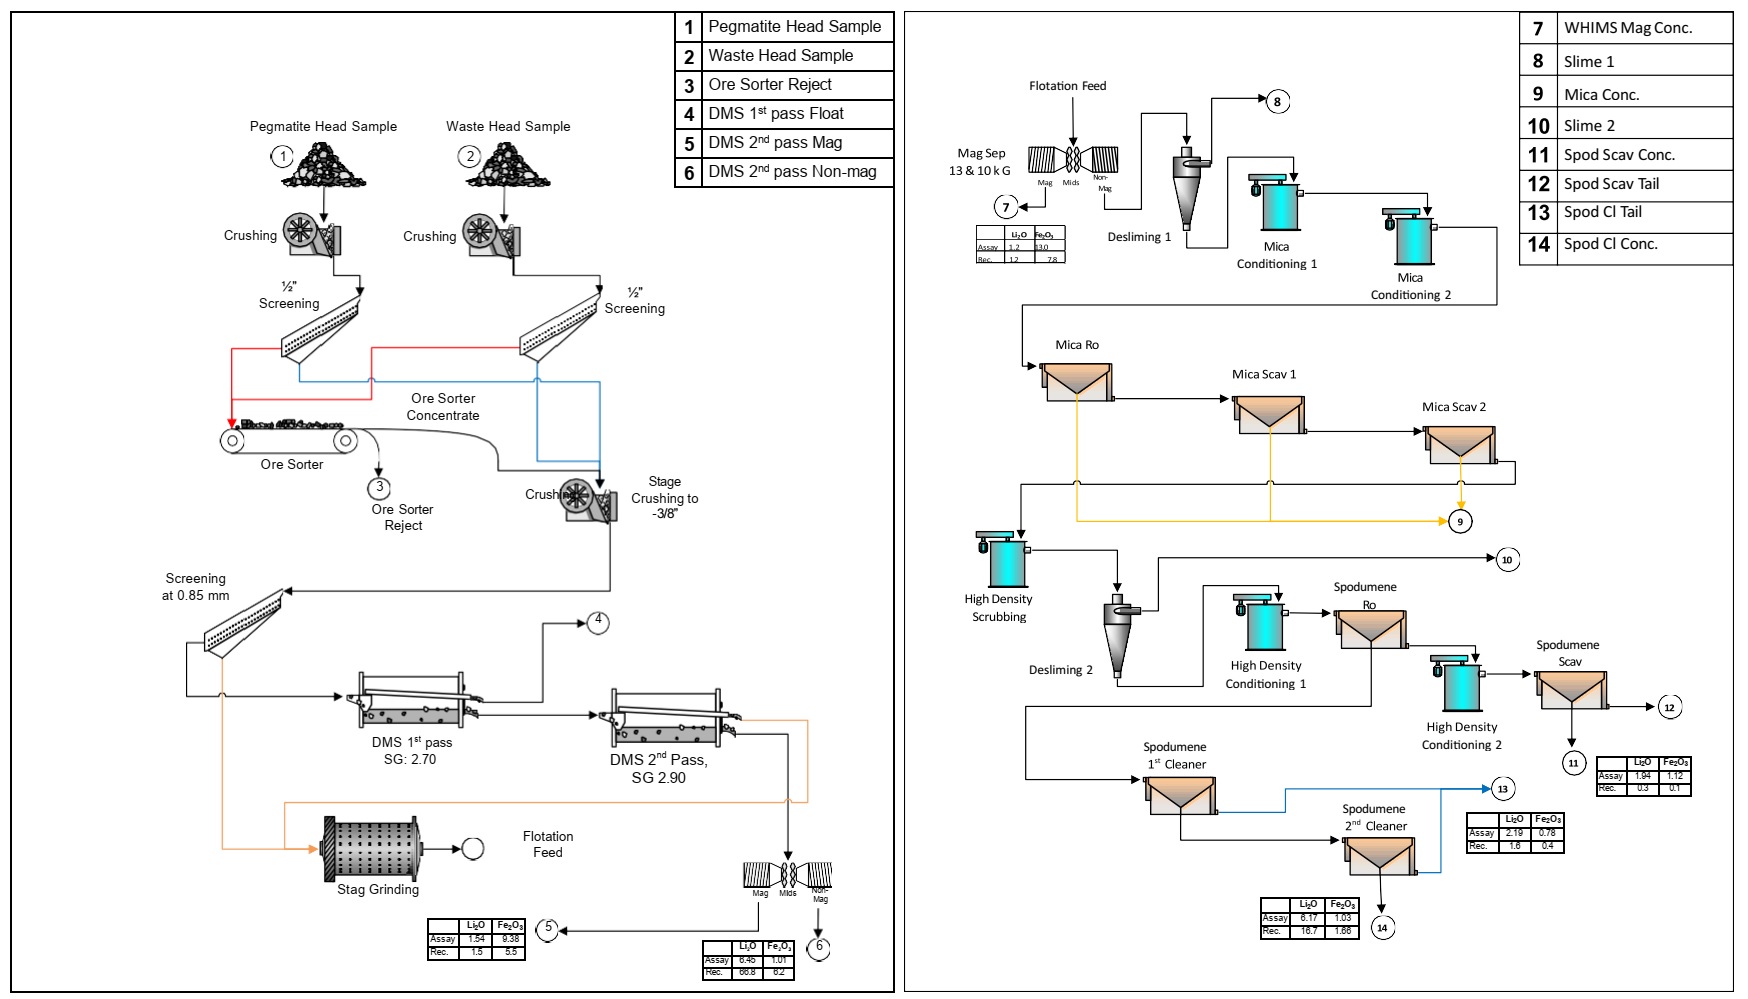
Figure I: Overall Process Flowsheet
To view an enhanced version of this graphic, please visit:
https://images.newsfilecorp.com/files/9547/158652_snowlakefigure1.jpg
Qualified Person Statement
Mr Brent Hilscher P.Eng., Vice President of ABH Engineering Inc., who reviewed the studies and test work conducted by SGS on behalf of Snow Lake Resources compiled and evaluated the technical information in this release and is satisfied with the results. Mr Hilscher does not take responsibility for test work and is a member of the Association of Engineers and Geoscientists of British Columbia (EGBC), which is ROPO, accepted for the purpose of reporting in accordance with SK-1300. Mr Hilscher has sufficient experience relevant to Lithium and Lithium technology and processing to qualify as a qualified Person as defined under SK-1300 guidelines. Mr Hilscher consents to the inclusion in the report of the matters based on information in the form and context in which it appears based off SGS test work.
About Snow Lake Resources Ltd.
Snow Lake is committed to near term production and cash flow lithium mine through conventional truck and shovel mining methods to supply the North American electric vehicle and battery markets.
Our wholly owned Snow Lake Lithium™ Project now covers a 59,587-acre site that has only been 1% explored and contains an identified-to-date 11.1 million metric tonnes indicated and inferred resource at 1% Li2O.
Forward-looking Statements
This press release contains "forward-looking statements" that are subject to substantial risks and uncertainties. All statements, other than statements of historical fact, contained in this press release are forward-looking statements, including without limitation statements with restoring Snow Lake Lithium. We base these forward-looking statements on our expectations and projections about future events, which we derive from the information currently available to us. Forward-looking statements contained in this press release may be identified by the use of words such as "anticipate," "believe," "contemplate," "could," "estimate," "expect," "intend," "seek," "may," "might," "plan," "potential," "predict," "project," "target," "aim," "should," "will," "would," or the negative of these words or other similar expressions, although not all forward-looking statements contain these words. Forward-looking statements are based on Snow Lake Resources Ltd.'s current expectations and are subject to inherent uncertainties, risks and assumptions that are difficult to predict. Further, certain forward-looking statements are based on assumptions as to future events that may not prove to be accurate. Some of these risks and uncertainties are described more fully in the section titled "Risk Factors" in our registration statements and reports filed with the Securities and Exchange Commission. Forward-looking statements contained in this announcement are made as of this date, and Snow Lake Resources Ltd. undertakes no duty to update such information except as required under applicable law.
For more information, please contact:
Investors: ir@snowlakelithium.com
Media: media@snowlakelithium.com
Twitter: @SnowLakeLithium
SOURCE: Snow Lake Resources Ltd.
![]()
To view the source version of this press release, please visit https://www.newsfilecorp.com/release/158652

Analyst, journalist, or company stakeholder? Sign up to receive news releases by email for Snow Lake Resources Ltd or all companies belonging to the Mining and Metals industry.